For this project, I wanted to explore the coverage of ghosts and haunted houses by The New York Times. I am the Senior Taxonomist for The New York Times and part of my work is to promote our archives and the use of our tool TimesMachine. I was inspired to do this research while looking for good material to tweet out for the @NYTArchives Twitter account around Halloween. I came across a number of gems and knew that there must be more.
The New York Times has been tagging content with metadata since 1851, so I knew that there should be tags that I could query to surface spooky material from the archives. I began by looking at one of the articles I had found for the Twitter feed. Viewing this article in TimesMachine, I could see that the tag “Ghosts” was associated with the content. I looked at some other articles on hauntings and found that there was also a tag for “Haunted Houses.” I decided to use these tags as a guide to query for content. Knowing that locations were also often tagged to articles, I thought that it would be possible to map these instances geographically so that one could see where these hauntings, some debunked, were happening. I was able to ultimately query on the subject tags using an internal New York Times search API and map the results using Tableau Public.
The Process:
I decided to explore using the APIs available at the New York Times Developers Network. I knew that there was a Times Tags API and I hoped that would provide me with all the results I needed. Getting an API key, was quick and easy, but once I had one, I discovered that the Times Tags API was down and not likely to be fixed in time for me to use it for this project. So I looked at the other APIs available and thought that I could perhaps use the Article Search API. Once I obtained the API key for that API, I attempted to query with it. But the results were disappointing. The API did not allow for searching on the tags effectively and the words “ghosts” and “haunted” in a text search gave me a lot of garbage results. There was a way to search on the keywords, but I was having trouble making that work for the subject tags I had identified. For instance, I practiced on tags that I knew existed in the database, but I was getting zero results for those searches.
Frustrated, I nudged the NYT search team for some guidance. It was then, that I was told I could just use the internal search API. Not only would I not have to wrangle with an API key, I could also search both the tags and in the headline or body at the same time if needed. I was sold.
I began by using the payloads method in Python to craft a query that searched for anything tagged with the subject “Ghosts” or the subject “Haunted Houses” in all dates.
  payload = {'fq': 'subject:("ghosts","haunted houses")’}
  r = requests.get('Internal API’', params=payload)
Doing this, I got a fair amount of results, but they included a lot of recent material that was not the type of thing I was looking for. Looking at the dates, I determined that the type of material I was searching for was published between 1851 (the first year the paper was published) and 1935. Knowing this, I added a date range to my query:
payload = {'fq': 'subject:("ghosts","haunted houses")' ,'begin_date': '18510918' , 'end_date':

'19351231'}

r = requests.get('Internal API', params=payload)
Those results were better, but looking through the JSON that was spit out, I didn’t see headlines for some of my favorite ghost related articles. Knowing that those articles existed, I took a look at them in TimesMachine to check the tags associated with them. It was then that I realized that those articles did not have the “ghosts” or “haunted houses” tags as they were purely tagged with a location. So I added a headline piece to the query in order to get those articles in my result set.
  r = requests.get('Internal API', params=payload)

payload = {'fq': 'subject:("ghosts","haunted houses") OR headline:("A Ghost in Long Island

City","Flatbush Has a Ghost","spectral lodgers")' ,'begin_date': '18510918' , 'end_date':

'19351231'}
The query now seemed to be correct, but I was not getting all of the results of the query due to pagination issues. I needed to tell the script to keep going and not stop at the first page of 10 results. The JSON revealed that there was a field that contained information on how many hits were returned from the API call. Using this field, I was able to set up a variable for the total number of hits and a variable for the counter and loop through the data so that it kept going until the counter reached a number that was higher than the amount of results that were returned. Once that was in place, I was able to retrieve all of the results I needed.
total_hits=data['response']['meta']['hits']
counter = 0

while counter < (total_hits/10+1):
  r = requests.get('Internal API', params={'fq': 'subject:("ghosts","haunted houses") OR
  headline:("A Ghost in Long Island City","Flatbush Has a Ghost","spectral lodgers")' ,
  'begin_date': '18510918' , 'end_date': '19501231', 'limit': 10, 'offset': 10 * counter})
  counter = counter + 1
After getting the script to loop through each page of results, I needed to decide what pieces I wanted to extract from it. I decided that for each result, I wanted to show the headline, the publication date, the location tag, the abstract of the article and the URL of the article. I realized at this point that not every article was tagged with a location tag (called glocations), so to make sure that it printed it when it existed, I needed to insert a loop for that portion to make sure the script grabbed it when it was there.
for a_doc in data['response']['docs']:
  headline = a_doc['headline']['main']
  publication_date = a_doc['legacy']['dat']
  abstract = a_doc['abstract']
  glocations = '
  for a_keyword in a_doc['keywords']:
    if a_keyword['name'] == 'glocations':
    glocations = a_keyword['value']
    url = a_doc['legacy']['web_url']
Once, I could see that all my data was printing out the way I wanted it to, I was ready to write it out to a JSON file. I did this by creating an empty JSON dictionary and using loads and dumps to get all of the data out of the API and into the empty dictionary, which was written out to a JSON file.
a_ghost_dict = {"Headline": headline, "Publication Date" : publication_date, "Abstract": abstract, "Location": glocations, "URL": url }
all_ghosts.append(a_ghost_dict)
with open('nyt_article_results.json', 'w') as f:
  f.write(json.dumps(all_ghosts,indent=4))
In the end, this was my full script:
import requests, json
all_ghosts = []
payload = {'fq': 'subject:("ghosts","haunted houses") OR headline:("A Ghost in Long Island City","Flatbush Has a Ghost","spectral lodgers")' ,'begin_date': '18510918' , 'end_date': '19351231'}

r = requests.get('Internal API’', params=payload)
data = json.loads(r.text)
total_hits=data['response']['meta']['hits']
counter = 0
while counter < (total_hits/10+1):
  r = requests.get('https://search-add- api.prd.iad1.nyt.net/svc/add/v1/lookup.json', params={'fq':'subject:("ghosts","haunted houses") OR headline:("A Ghost in Long Island City","Flatbush Has a Ghost","spectral lodgers")' , 'begin_date': '18510918' , 'end_date': '19501231', 'limit': 10, 'offset': 10 * counter})
  counter = counter + 1
  data = json.loads(r.text)
  for a_doc in data['response']['docs']:
    headline = a_doc['headline']['main']
    publication_date = a_doc['legacy']['dat']
    abstract = a_doc['abstract']
    glocations = ''

    for a_keyword in a_doc['keywords']:
      if a_keyword['name'] == 'glocations':
        glocations = a_keyword['value']
        url = a_doc['legacy']['web_url']

        a_ghost_dict = {"Headline": headline, "Publication Date" : publication_date, "Abstract" :abstract, "Location": glocations, "URL": url }
        all_ghosts.append(a_ghost_dict)

with open('nyt_article_results.json', 'w') as f:
  f.write(json.dumps(all_ghosts,indent=4))
I wanted to look at my data in an excel spreadsheet and knew that I would probably want to work with it in that format when I started mapping my data. So I found the json-xls converter online and used that to turn my output into a xls file. Once my data was in that format, I looked for any holes or bad results.
The first thing that I noticed was that half of my data did not have a location tag. Spot checking a few of these links through TimesMachine, I saw that this data was indeed missing from these articles and that it was not the fault of the script. My original thought was that I could find the locations in the text of the articles using regex as I imagined that most of them would have a dateline or other pattern in the text that would relatively easy to match on. Because of the format that these results exist in, however, this ended up not being the case. The articles exist in PDF form and also in a zoomable scan of the paper. Neither of these formats allowed me to do the text searching that was necessary to use regex. Since I had pulled the URL for each result and since there were less than 50 results that needed locations added, I decided the most efficient thing to do was to follow the links, read the article to find the location and to fill it in manually.
Now that the location results were all filled in, it was time to work on mapping my data. I decided to use Tableau Public to accomplish this task as it seemed to have the ability to create maps with pop ups that would provide the viewer with all the information that I had pulled with my script.
Using Tableau had its challenges for a beginner. The first thing I discovered was that it would not recognize my locations because they were not in a consistent format. While I had initially thought that my results would mostly be tagged with New York City, or a narrower location within the city, this did not prove to be the case. There were locations throughout the world and how granular those locations were varied. In some instances, I had a New York City borough or neighborhood, some had city and state, some just a city and some just country or just state. To normalize my locations, I decided to map them all to a latitude and longitude value. I converted my addresses to latitude and longitude using an online converter. I put the location value in a separate xls doc so that I could map one xls to the other based on that column and I matched the latitude and longitude values with the locations in that second xls.
I loaded these excel documents into Tableau and I ended up with a map. I was very excited, until I realized that there was a problem. When I had more than one story at the same location, it was only showing one of those results. It would not allow me to have multiple results at the same latitude and longitude. I searched around for solutions to this issue as it seems like a common problem that would arise. I was able to find a solution that involved something called “jittering.” Unfortunately, the documentation for this solution was no longer available on the web. After much more searching, I realized that I could probably troubleshoot this issue by making each duplicate location a slightly different latitude and longitude that would keep it technically in the same location, but might be a street over from the central latitude and longitude that is the default for that location.
The first step was to identify the duplicates. I looked through the excel document I had made to hold the locations with the corresponding latitude and longitude. I then identified the duplicate locations and appended a number to the end of each so that they would no longer be the exact same value. Once I had done that, I changed the title of the column to “location alias” and added that column to the original excel document with the results from the api. I then went through each item in the “location alias” column and swapped in a new latitude and longitude from the corresponding location into the latitude and longitude columns for that item. With the results that took place in New York City, I was able to find a neighborhood for most of them, so I made sure that the latitude and longitude landed the pin in that neighborhood. For other locations, such as the multiple results in Antigonish, Nova Scotia, that were really the same location, I just picked latitude and longitude coordinates that were within that city and close to each other. Once I updated both excel documents and created a new map, I was then able to see separate marks on the map for all the results.
Success!
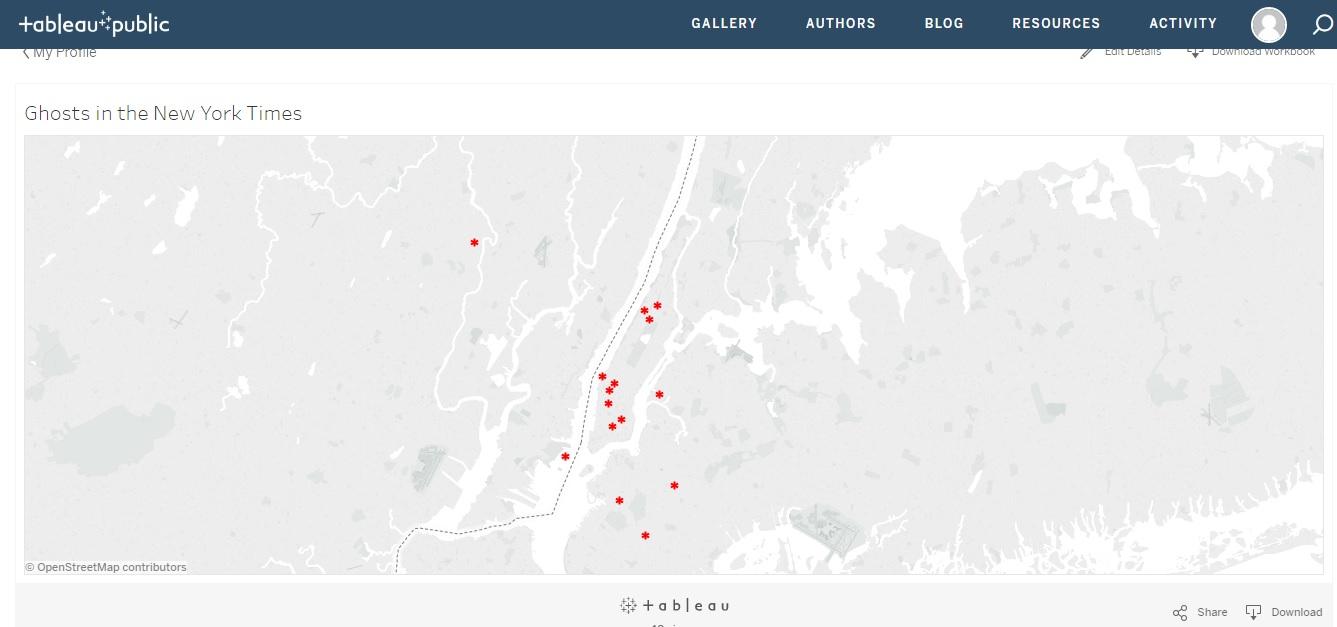
The last thing that I wanted to add to my map was the ability to hyperlink within the pop-up “tooltips” that are displayed once you click on a point on the map. I was hoping to link each article url so that when you clicked on it, it would open a new window and allow the user to go right to the article in TimesMachine. Unfortunately, this does not seem to be possible in Tableau Public. I spent many hours searching and learned that I could only make a universal action for all tooltips. For example, if I linked the url for one article within one tooltip, it would be linked for all other tooltips. This was discouraging. Since I could not link, I ended up just including the url in the tooltip. This means that the viewer can at the very least copy and paste the url into a new tab. It’s not exactly how I wanted it to work, but it will do. In the end, I was pretty happy with my map and the way it represents my data.
The final map