
For this project, I chose to explore some of the online data about Old Time Radio, which is usually defined as the radio shows that aired between 1920’s-early 1960’s. While there is a huge amount of information about these shows online, much of it is incomplete, difficult to access, and spread apart. I wanted to try to centralize some of this information and use visualization to explore the dominant personalities within the data set as well as the working relationships of the stars of OTR.
I chose to focus on the online Radio Logs from OTRSite.com, which are fairly comprehensive, but, as is typical with many of these sites, spread the data across separate show pages, lacking a combined database of all shows. In order to pull out the data, I wrote a two-part code using Beautiful Soup to first scrape the individual show URL’s from www.otrsite.com/radiolog/, saving them to a CSV file, and then looping through each URL to pull out chunks of text from each individual show page. As the site’s source code is almost entirely unstructured and minimally styled HTML, my code looked for any font tags with a size attribute of either 3 or 4, which contained both the show titles as well as any personalities appearing in the show. Due to the nature of the data, this code captures recurring stars on an overall show level rather than the casts of particular episodes. This data was written to a text file and then parsed using RegEx to pull out the show titles as well as the names of stars, announcers, and hosts from the extraneous text.
After cleaning and normalizing my data, I loaded it into Tableau and found the top 50 personalities that appeared on the most shows. I then put those names into another CSV file along with links to their DBPedia page and wrote a final piece of code to access the JSON data from DBPedia and pull out the person’s biography. Any missing bio’s were filled out using data from IMDB.com. Finally, I manually looked up links to audio files on the Internet Archive and loaded all of my data into both Tableau and Gephi to create the visualizations seen on the PythonRadio website.
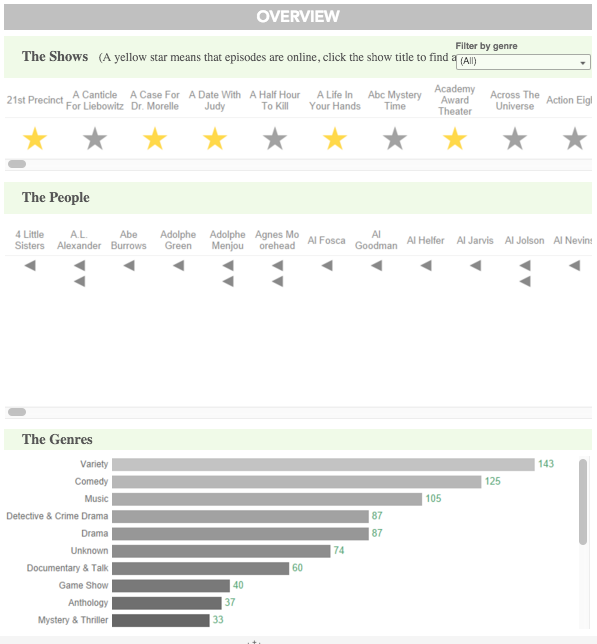 The Shows - Interactive Version
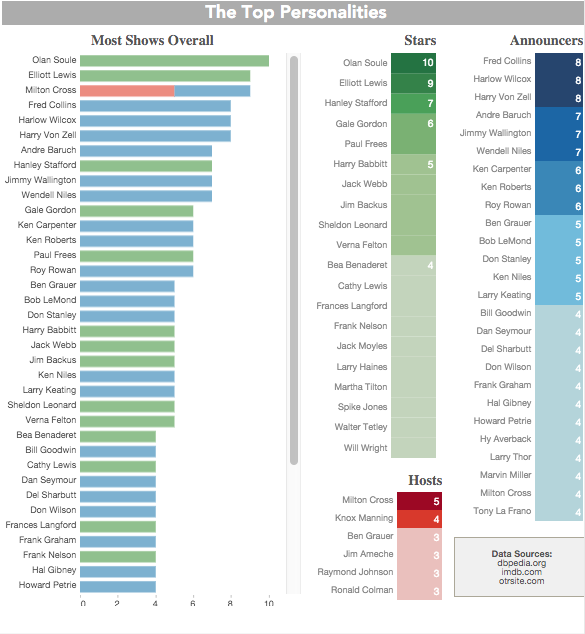 The Stars - Interactive Version
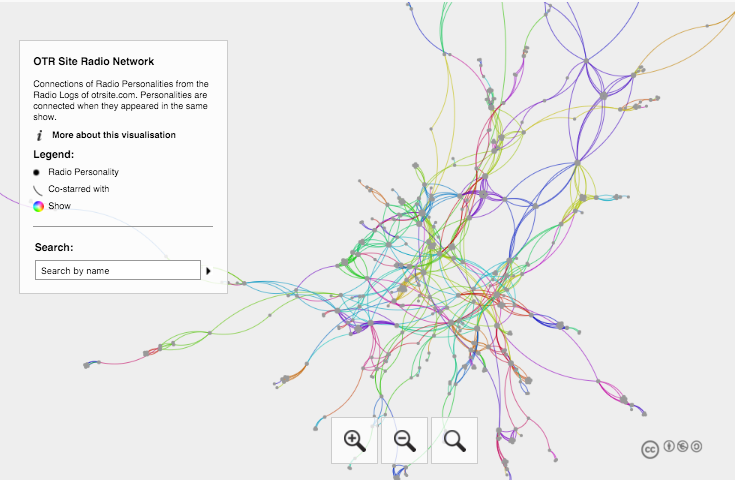 The Network - Interactive Version