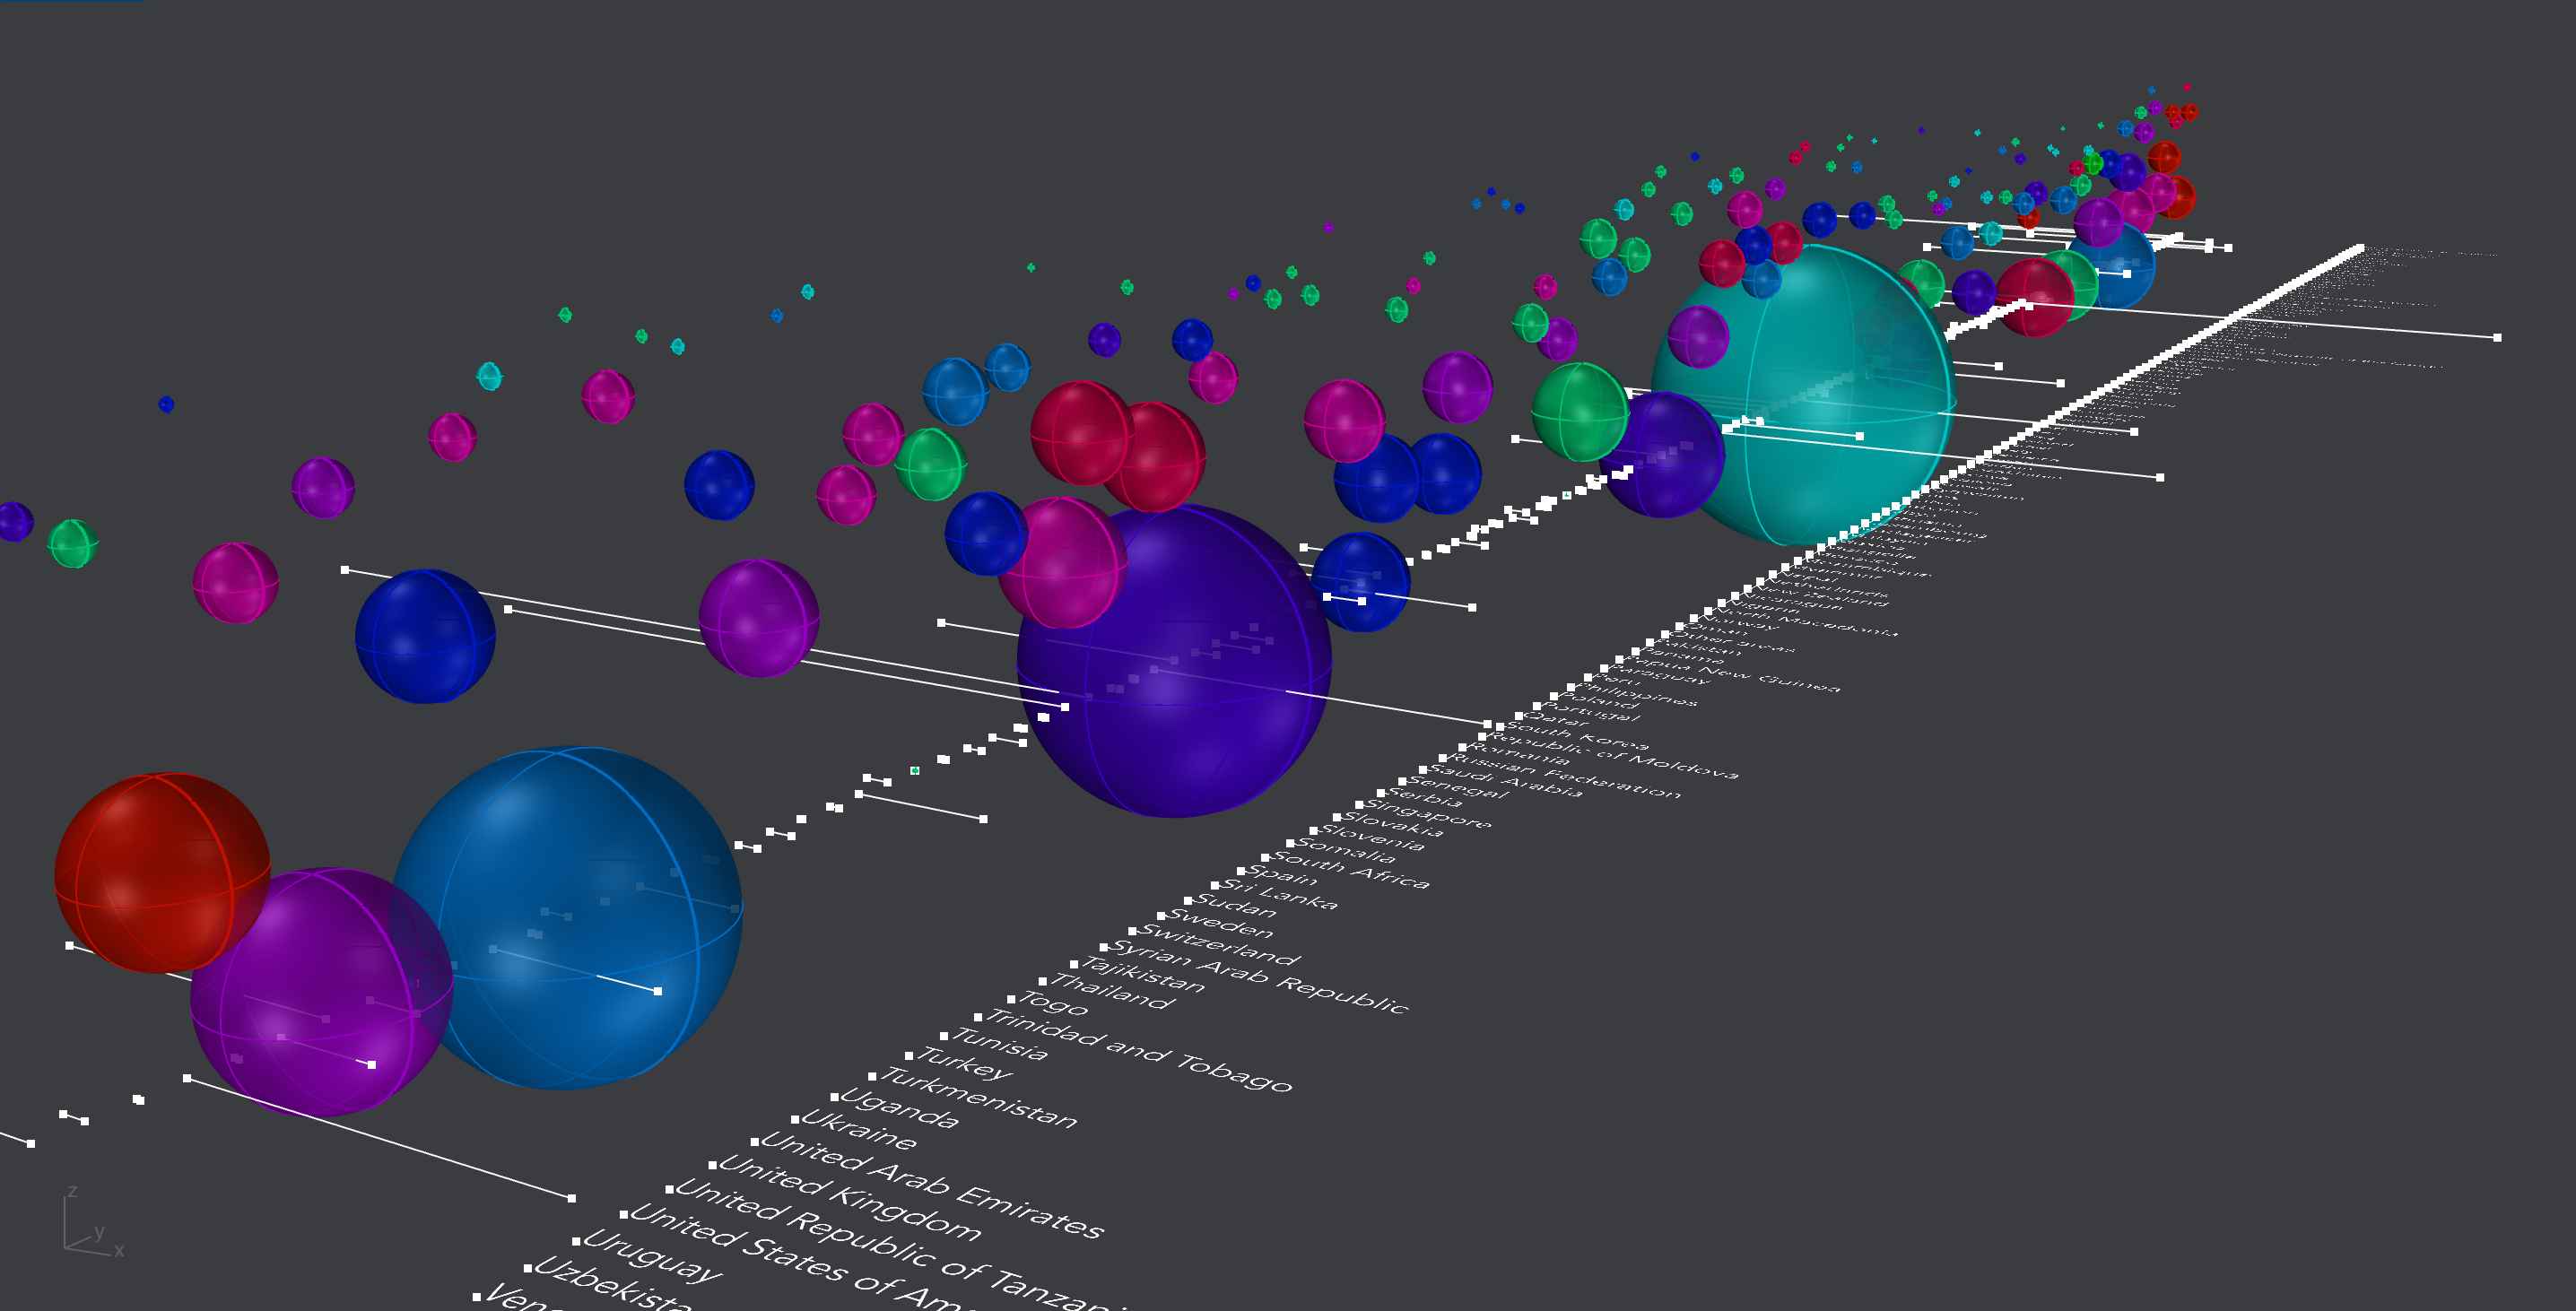
This was an exploration of RhinoScriptSyntax, a python enabled function of Rhino 3D modeling.
By uploading CSV files into Rhino, data can be visualized both in 2D and 3D space, with the customization
of any design concept. After a variety of experiments were more finalized to show three useful attributes
of this python use. The first, a view into world energy use, explores 3-dimesional space, utilizing color,
size, and location of spheres to tell a story. The second, builds a graph from East River bridge bicycle
ridership, using the feeling of a bridge form to construct the visualization. Lastly, a rendered model of
a skittle is used and dimensioned based upon the dataset. All three examples explore a way to import a CSV
and visualize it in Rhino.


