
Why am I interested in this topic?
This project is based on personal interest.My new yorker story started from fall 2018, my friends visited me when they know I arrived, I am new here, and I was so new that I could not give them too much advice on places to visit,restaurant to check out...
After nine months, I started to know something about this city, I want to create a customized city guide, instead of checking google or yelp every time.I tried to asked myself this question, what’s your impression about New York. The first thing comes into my mind is homeless and fire trucks…
No, it’s the price tag, so expensive, we call it tag shock.When did I feel better about this situation?The first time I went into Trader Joe’s, 9pm,it was in basement floor People are in long lines paying for organic foods more affordable. It’s now because the price is low,it’s lower, but because I see people like me, and even people go to work here when they get of from work,They still shop grocery like me. More recently, I started to love trader joe’s premade salad and it’s only four dollars.
I also found that, people here eat outside not necessarily means go to a restaurant, people would bring their brown bags and sit at a park, some with their dogs, when it is not raining.
So how about rainy days, yes, visiting museums and galleries is a good choice here in New York, as New York is famous for its artistic and cultural environment.

Gif credit: Christoph Niemann for The New Yorker magazine
After visiting museums, if my visitors don’t like Chinese food here tasting too tangy, I’ll bring them to Izakaya, the japanese restaurant with sake and teppanyaki.
- Trader Joe's
- Parks
- Museums
- Izakaya
These are the four categories discussed in this project:
Where did I request data from?
When I try to combine all these together, there’s one good thing about big cities, they use the same apps. So I come to Yelp API and hope that I can generate results from the dataset instead of clicking for researches and mark them down every time.
So I turn to Google, searched Yelp and chose the link with developers. Yelp has a name fusion for the place where holding all the APIs. And there are three endpoints of business, event and category, since I am going to request information about businesses, so I used the first one most of time.
What obstacle have I overcome?
There’s one thing I would like to mention here about the API key, is that Compared to what I did for another project with New York TImes API article search, they have different ways of holding api keys in urls. For nyts it is simple I just need to put ampersand followed by api-key equals and the long serial number. But for yelp fusion, i need to input comma headers equals and curly bracket, inside is authorization in quote, followed by a colon, then Bearer followed by the api keys in quote, too.
With the api keys recognized by Yelp, I was able to see the returning results in my terminal, and I want them, most of them dictionaries in list, to look pretty, I imported pprint from pprint. And I tell the for loop which terms I want to print out. And I also included that criteria that rating is higher than 4.
The next part is to write information I want to a csv file, since every time the result will write to the same csv, so I put a which stands for append rather than w as write to the mode. In the following lines, the code is helping me to write field names as this fields list I listed out all the terms i want here.
What tools have I used?
- Yelp fusion
- Kepler
- Github
- Sublime Text
I have used the following tools in my project here:
For a more user friendly output, I used kepler.gl, which is a data visualization tool or mapping tool for data with coordinates.
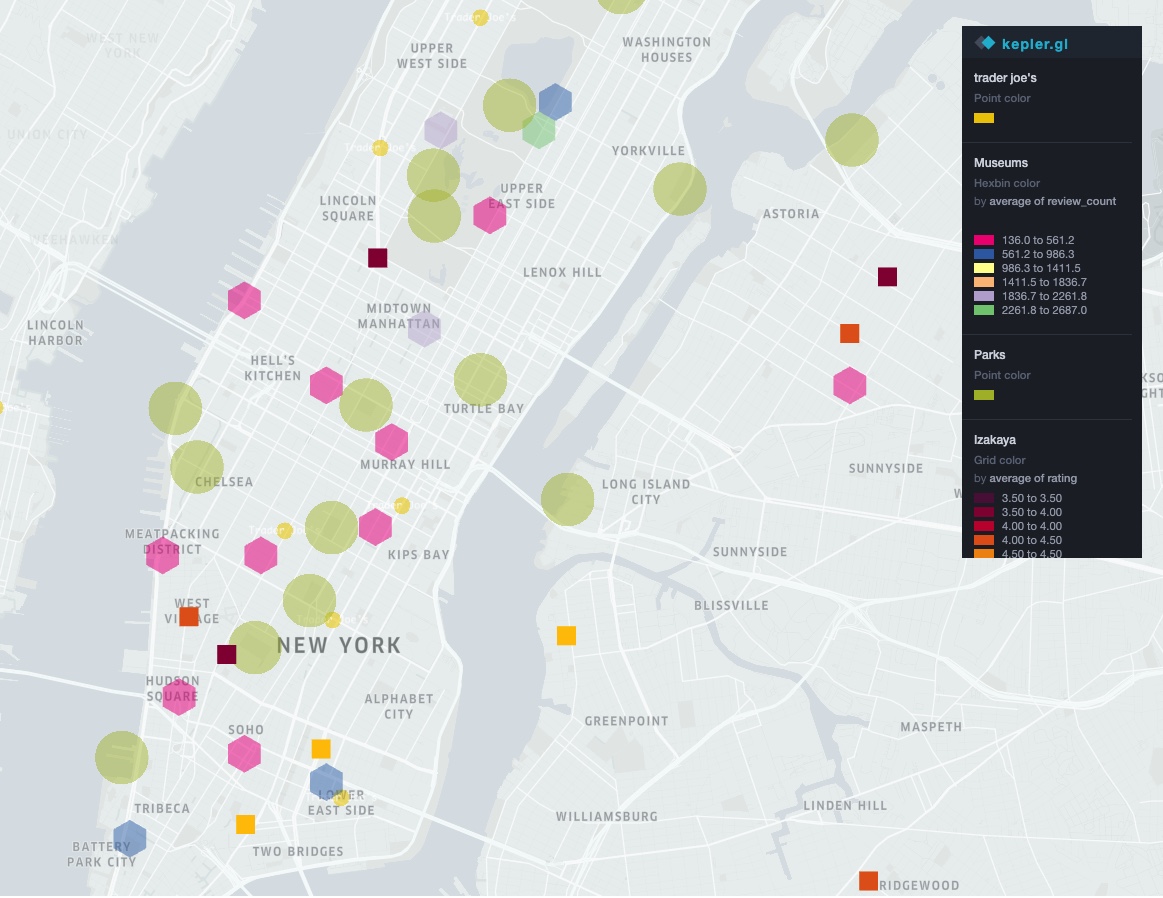
Fig.1 Overview Mapping of Interested Spots
The map is interactive, so I could zoom in and export as a graph, with all the street labled, and legend,I can also color those places based on categories like review_count or ratings.
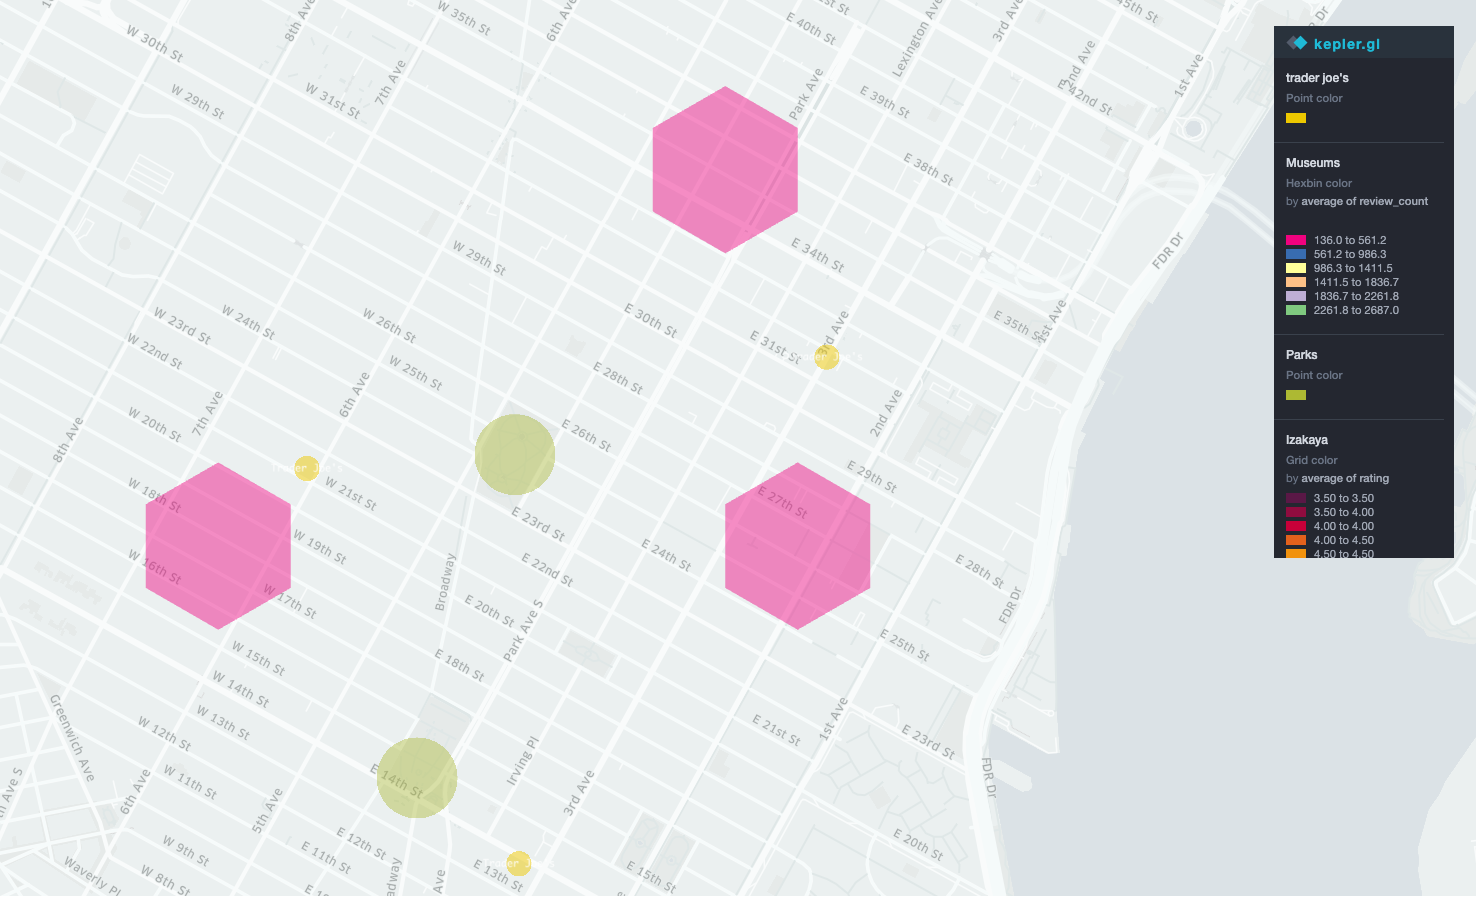
Fig.2 Zoomin View Mapping of interested spots
.I can also change the projection and 3D mode, so that instead of color variances, I can also introduce column height as another parameter. Kepler can also bring in time as a parameter.So in that case, it would be possible to bring in multiple or sequential data in to visual mode.
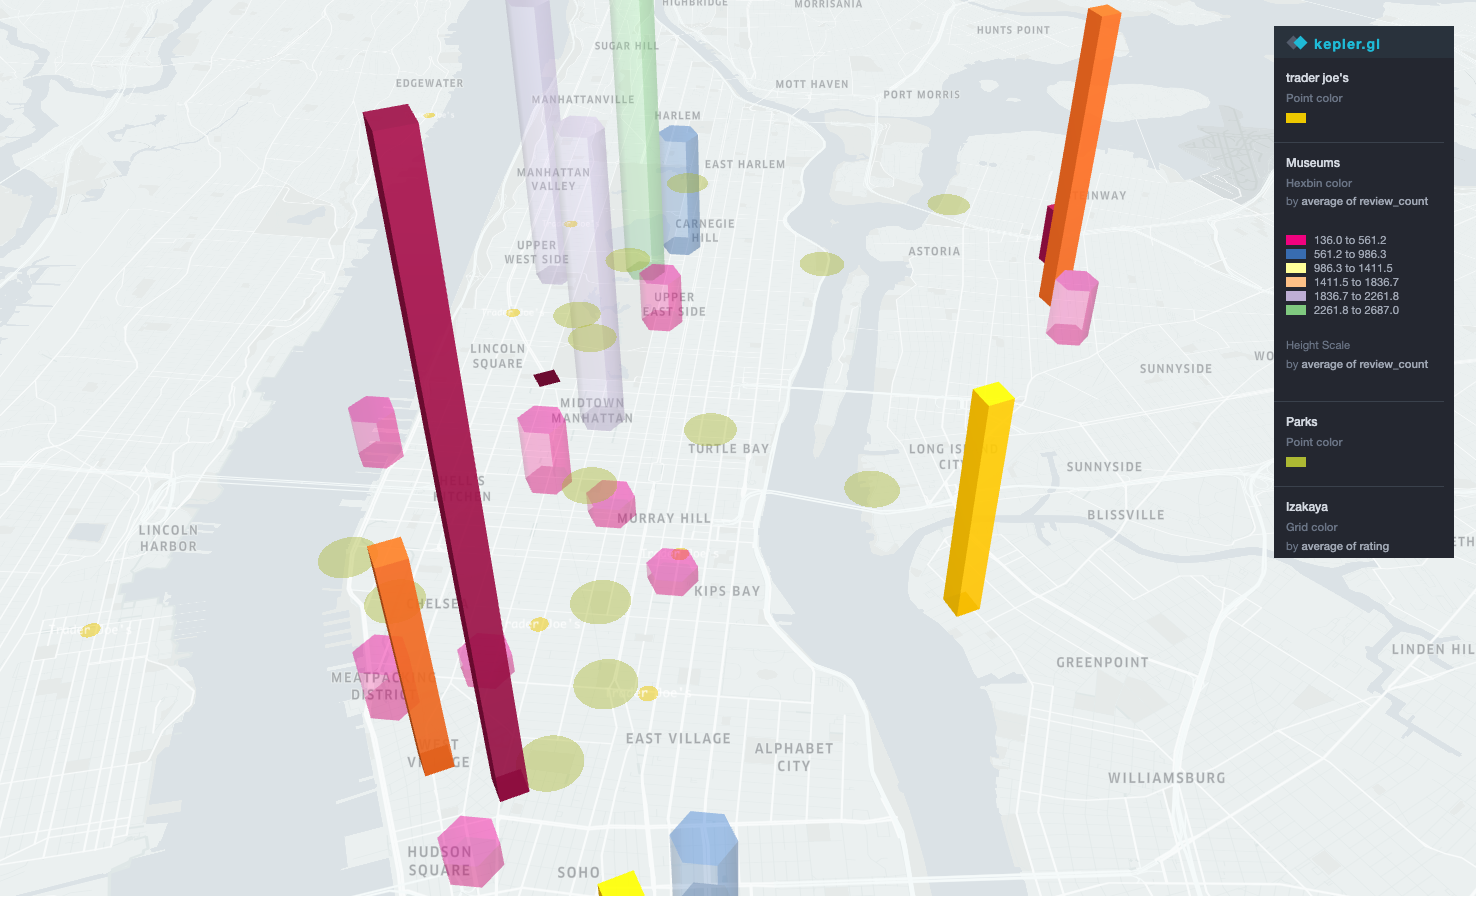
Fig.3 3D View Mapping of iterested spots
Reflections
After I have done this project, I must admit that this is what a one year old new yorker know about new york, and I believe that when I grow I will find more interesting but hidden spots, maybe not from Api. it could be from web scraping.
Check here for code.
Check here for code.